|
|
Cool Tools: a Periodic Table of Visualization Methods
 "If you've ever wondered how to model something, or were looking for new ideas for segmenting and presenting complex concepts,
this is an incredible online resource. A neat graphical explanation and example of each 'element' appears
as soon as your cursor scrolls over them...".
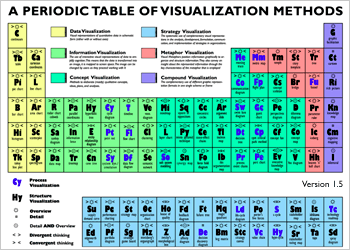
The 'Periodic Table of Visualisation Methods' (*) displays around 100 diagram types, with examples and a multi-faceted classification by:
* simple to complex
* data/information/concept/strategy/metaphor/compound
* process/structure
* detail/overview
* divergence/convergence
Created by Dr. Martin J. Eppler & Ralph Lengler, University of Lugano, Switzerland.
(*) Free
available here
— Dr. Hugo Heyrman
|| Museums of the Mind ||
|